Some places come and go, while some places become icons. Mandatory Milwaukee is all about the latter. Join us as we revisit beloved and well-worn local staples with fresh eyes, and explore how they might figure in the city’s future. This week: those posts and maps that show how Wisconsin has a bunch of the “drunkest cities in America.”
It’s as inevitable as death. It’s as reliable as a geyser. It’s as time-honored as the Packers blowing their first game of the season but going 13-3 anyway and then losing to the 49ers in the playoffs. It’s something you see people constantly sharing on social media:
Here are the drunkest cities and/or counties in America. Seven, eight, or nine of them—hell, maybe all of them—are in Wisconsin.
And yeah, it’s similar to how people constantly share that Wisconsin-heavy “bars vs. grocery stores” thing on social media.
Here are some headlines from the last eight years:
2022: “7 Cities in Wisconsin Top the List of the Drunkest Cities in America”
2021: “7 Of The 10 Drunkest Cities In America Are All In One State [Wisconsin]”
2020: “New study puts Wisconsin as No. 6 drunkest state”
2019: “Report: Wisconsin is home to 12 of the nation’s top 20 drunkest cities”
2018: “Top 10 Drunkest cities in America. Wisconsin has too many.”
2017: “7 of the 10 Drunkest Cities in America Are All in a Single State [Wisconsin]
2016: “Most of America’s Drunkest Cities are in Wisconsin”
2015: “Wisconsin Officially Drunkest State in All Measurable Ways”
Sharing these studies and articles inevitably leads to the decrying of Wisconsin’s “drinking culture.” Wisconsinites, we’re told, can’t do anything—eat, socialize, go to a park—without alcohol. Organizations, companies, and individuals that make light of that drinking culture are called out. The oft-vilified Tavern League is vilified once again. Someone mentions the Packers. The person who shared the study or article gets 8 billion likes and retweets. Say what you will about drinking, but tweeting about drinking is clearly good for engagement.
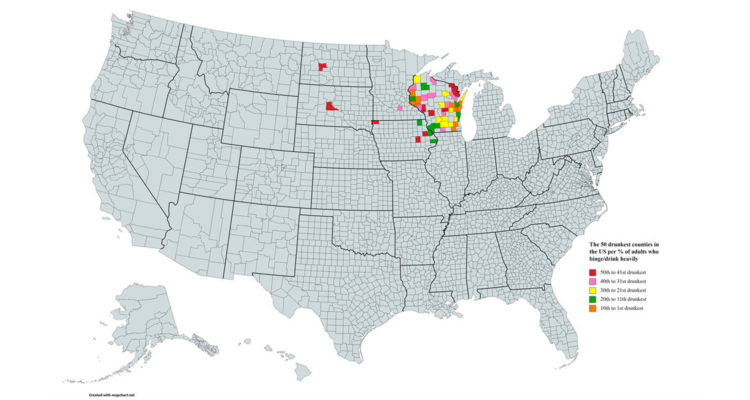
The 50 drunkest counties in the country (24/7 Wall St.) pic.twitter.com/UvPJyhCSR7
— Hayden Clarkin (@the_transit_guy) August 24, 2022
Most of these studies are the work of 24/7 Wall St., a website that, among other things, cranks out 8,000 disparate listicles a day. Each new “special report” is more tailor-made for lazy social media sharing than the last: “America’s Poorest Towns,” “30 Famous Steakhouses Owned By Celebrity Chefs,” “States Where Speeding Kills The Most People,” “The Biggest Pop Hits By The Beatles.” The list[icles] go on and on. It’s your run-of-the-mill content farm.
The methodology for these studies is typically more respectable, and goes something like this:
To determine America’s drunkest counties, 24/7 Wall St. reviewed rates of excessive drinking from the Robert Wood Johnson Foundation and the University of Wisconsin Population Health Institute joint program’s 2021 County Health Rankings & Roadmaps report.
The rate of excessive drinking is defined as the share of adults who report either binge drinking or heavy drinking in the past 30 days. Binge drinking is defined as consuming in a single occasion four or more drinks for a woman, or consuming five or more drinks for a man. Heavy drinking is defined as consuming more than one drink per day on average for a woman or consuming more than two drinks per day for a man
So where does the County Health Rankings & Roadmaps (CHRR) get its data? From an annual telephone survey called the Behavioral Risk Factor Surveillance System (BRFSS), apparently. How many excessive-drinking folks respond to this survey? CHRR doesn’t say, but it does explain that is also relies on “complex statistical modeling” to get its final results:
Statistical modeling is used to obtain more informed and reliable estimates than survey data alone can provide. Modeling generates more stable estimates for places with small numbers of residents or survey responses. Our Excessive Drinking estimates are produced from one year of survey data and are created using complex statistical modeling.
Are there drawbacks to using modeled data? Yes, there are drawbacks to using modeled data:
There are also drawbacks to using modeled data. The smaller the population or sample size of a county, the more the estimates are derived from the model itself and the less they are based on survey responses. Models make assumptions about statistical relationships that may not hold in all cases. Finally, there is no perfect model and each model generally has limitations specific to their methods.
For the 2022 County Health Rankings (which rely on data from 2019), data for each individual county in Wisconsin comes with an error margin of about 25%.
Which isn’t to say that these studies are unreliable, or that Wisconsin doesn’t drink a lot. Clearly, we do. But, you know, for better or worse, we know. Do we really need another reminder? We know.
Appleton, by the way, is 2022’s drunkest city in America. Sheboygan, Green Bay, Oshkosh-Neenah, Madison, Fond du Lac, and La Crosse-Onalaska all make appearances in the top 10.
Exclusive articles, podcasts, and more. Support Milwaukee Record on Patreon.
RELATED ARTICLES
• Full “Mandatory Milwaukee” archive
• Mandatory Milwaukee/Wisconsin: Sharing that “bars vs. grocery stores” map on social media