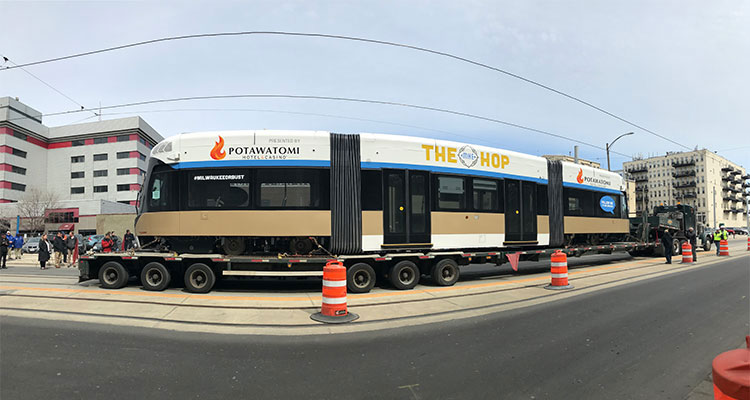
Milwaukee’s forever controversial streetcar system, The Hop, celebrated its first birthday last week. Happy birthday, The Hop! Even better, it was announced that Cleveland-based technology firm Everstream would be plunking down $90,000 to sponsor a “holiday-themed” streetcar and keep the entire system free throughout the holidays. Thanks, Everstream!
But a very important and increasingly tiresome question remained: HOW MANY PEOPLE RODE THE STREETCAR IN OCTOBER AND HOW QUICKLY CAN WE SCRAP THE WHOLE THING IF IT WASN’T A MILLION AND HAHA HOW ARE YOU GOING TO PAY FOR THIS THING AND THE HOP IS FLOP AND THE HOP IS A BOONDOGGLE AND FARTFARTFARTFART SEND.
Turns out, 62,010 people rode The Hop in October 2019. That’s an average of about 2,000 rides per day. A 2011 study projected 1,800 rides per day. Two-thousand is more than 1,800.
BUT STILL. October 2019 is down from September 2019 (66,986 total rides), which itself was down from August 2019 (80,113 total rides), which in turn was down from a record-setting July 2019 (103,625 total rides). We’re no scientists, but perhaps summer weather and festival season might play a part in streetcar ridership. WEIRD.
As for the HOW ARE YOU GOING TO PAY FOR THIS THING AND WHAT HAPPENS WHEN IT’S NOT FREE question, here’s some handy info from Urban Milwaukee:
According to the city’s budget, The Hop’s 2019 operation will be funded by a federal grant for operations ($3,457,754), the 12-year, $10 million Potawatomi Hotel & Casino sponsorship ($691,670) and other advertising deals ($250,000).
Fare equipment, for which $400,000 remains set aside from the project’s $128 million capital budget, has not been purchased. As part of the deal to bring the Democratic National Convention to Milwaukee, the system must be free while the convention is in town.
The whole expansion thing remains a mess.
Anyway, here are the numbers so far. Happy winter, Milwaukee.
NOVEMBER 2018
Total rides: 80,361
Average daily ridership: (excluding opening weekend): 2,459
DECEMBER 2018
Total rides: 76,131
Average daily ridership: 2,456
JANUARY 2019
Total rides: 48,354
Average daily ridership: 1,560
FEBRUARY 2019 (estimated, due to missing data)
Total rides: 45,000
Average daily ridership: 1,607
MARCH 2019 (estimated, due to missing data)
Total rides: 50,000
Average daily ridership: 1,613
APRIL 2019
Total rides: 55,657
Average daily ridership: 1,855
MAY 2019
Total rides: 62,937
Average daily ridership: 2,030
JUNE 2019
Total rides: 71,367
Average daily ridership: 2,379
JULY 2019
Total rides: 103,625
Average daily ridership: 3,343
AUGUST 2019
Total rides: 80,113
Average daily ridership: 2,584
SEPTEMBER 2019
Total rides: 66,986
Average daily ridership: 2,233
OCTOBER 2019
Total rides: 62,010
Average daily ridership: 2,000

